1. PV SYSTEMS VALIDATION
There are many reasons why systems could perform differently at different sites (solar resource, environmental conditions, etc.). One of the objectives of the validation work is to measure and document these differences with the goal of improving industry’s ability to predict the output of new technologies regardless of where they are deployed. Detailed performance monitoring is essential to ensure that the performance and reliability modeling tools used by industry and by independent engineers to assess bankability are able to predict power and energy output from such systems for any location over time. Detailed monitoring also enables early detection of module degradation, infant mortality failures, and early indicators of potential failure modes. The RTCs will draw on many years of experience with installing and validating renewable energy systems with industry partners, to lead the analysis of data gathered, and to assess the initial durability and reliability of the systems. The validation plan developed by the RTC team is based on the testing and monitoring required to develop a technical data set to support bankability; the data and processes needed to develop standards and guidelines for performance validation, performance model validation, monitoring practices in the field, and data filtering; and the process for validating the test systems. The validation plan is set up to assess all aspects of a PV system throughout its lifetime. It is organized into four main areas:
- Design Evaluation and Acceptance Testing (Commissioning)
- Performance and System Monitoring
- Analysis and Modeling
- Reliability and Safety
1.1 Design Evaluation and Acceptance Testing
PV system designs can vary significantly due to the variability in component characteristics, technology choices, and site specific factors. Activities that aim to validate a PV design to increase investor confidence include ensuring that the design is well documented, meets applicable codes, and the energy production from the system has been predicted in an acceptable way, using appropriate models and data. In order that performance can be predicted accurately, it is essential to fully understand the ability of the manufacturer to characterize its products (e.g., module) and the capability of modeling software to represent these performance characteristics. Once the plant is built, it is important that the installation can be verified and that all components in the system are operating properly. The RTC team will work with the partners to verify the systems are designed and built to specifications. The RTC team will be responsible for independently testing a statistically significant sample of modules indoors and outdoors to verify the module manufacturer’s data set and power distribution provided.
Download the detailed RTC Commissioning Procedure:
RTC Commissioning Process Ver. 1.0 (539738 downloads)
1.2 Performance and System Monitoring
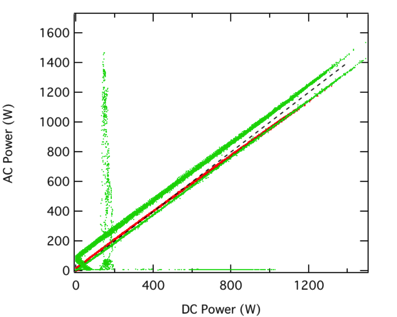
Each of the RTCs will use the same (or equivalent) metrology equipment, baseline test equipment for assessing module and string performance, and equipment for periodic testing in the field. In addition, there will be a recommended data monitoring system for collecting field performance data. Each system will be monitored to detect component and system failures as well as to validate that the various components or parts of the system behave consistently and predictably. At the top level, output power from each full system will be monitored at near real time. Monitoring at this level captures electrical performance of the entire system and will include monitoring on the AC and DC sides of the system relative to weather data recorded from a research grade meteorological system. Monitoring at lower levels in the system (e.g., subarray, string, or even module) provides more detailed information about how consistently each part of the system is performing. Figure 1 shows an example of monitoring data at the string level. It demonstrates how monitoring data can help to identify problems. Data obtained at this lower level is especially useful for identifying component failures and problems, uneven soiling and possibly even degradation. For example, if a system is monitored at the string level, output from each string will be compared by normalizing output (e.g., by DC capacity). Monitoring at points internal to the system (e.g., subarray, string, module) captures the DC electrical performance at the component or subsystem level but also costs more to implement and maintain. The RTCs will work with the specific RTC partner to define the appropriate level of monitoring. At a minimum we recommend monitoring 10% of the strings in the system.
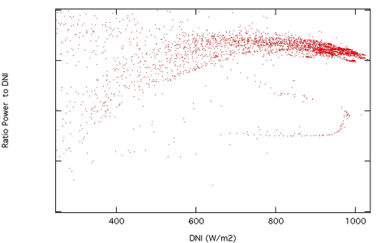
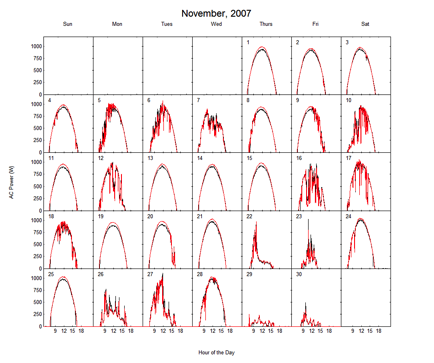
The performance and inspection data will be summarized and shared with the RTC partners quarterly and will include monthly irradiance and power over time and monthly performance ratios. Figure 2 shows a plot of system power as a ratio to direct normal irradiance (DNI), demonstrating the uniformity of the system response to irradiance. Daily plots with daily profiles (calendar view) are also useful for comparing the performance over the month (Figure 3).
1.3 Analysis and Modeling
For a PV technology to be “bankable” it must be predictable so that investors understand how the systems will function in a variety of environments and climates. The RTCs will provide a unique opportunity to test the ability of selected performance models in three distinct environments. Since performance models require sets of calibrated coefficients in order to run, it will be important to maintain a separation between calibration and model evaluation (and validation) activities. A modeling analysis of a system’s performance will be done at regular intervals and will be reported to the partner. For each interval, the analysis will follow a series of steps:
- Weather and performance data will need to be filtered to remove outliers and problematic data that cannot be explicitly represented in the model and will be rigorously documented (e.g., operational events, component failures, snow, etc.).
- Model will be run to predict quantities of DC and AC power, module temperature, and DC voltage.
- Both measured and modeled quantities will be used to calculate energy, energy yield (kWh/kWp), performance ratio (PR), AC efficiency, and power rating.
- Comparisons between predicted and measured data will be performed. This comparison can be done at a number of different levels.
a. Compare power and total energy produced over a given period.
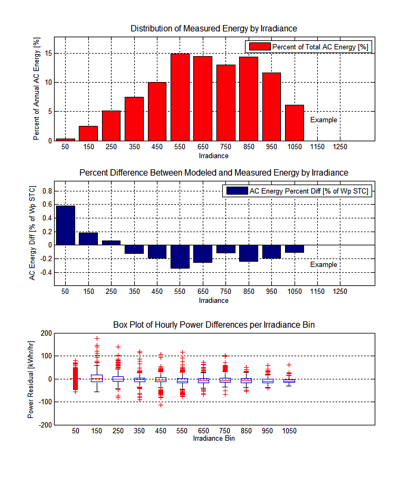
b. Calculate a model residual (modeled quantity – measured quantity) and evaluate whether this “error” exhibits any systematic patterns (e.g., are residual errors correlated with other variables such as irradiance and temperature?). Such correlations can suggest possible model improvements and/or problems with the PV system or components. Figure 4 demonstrates an example of calculating residuals (2).
The goal is to share what is learned with the public with regard to analyzing the results of each test sequence. This may be in the form of protocols and procedures, or as reports based on aggregated data. Where appropriate, the RTCs will use existing standard test protocols. However, many areas of validation are currently not standardized. For these areas, the RTCs will write the protocols and update them based on results from the first installations. The RTCs will develop standard data analysis packages based on the technical bankability requirements. This information will be used to determine modeling uncertainties as well as performance issues, and to support the development of standardized methods for validating performance prediction algorithms. If the systems are under test for three or more years, the RTCs will have the opportunity to assess and quantify system losses such as soiling, degradation rates, module mismatch, and field failures, which will be tracked in an operations and maintenance database.
1.4 Reliability and Safety
Validating the reliability of a PV system is an important attribute that investors consider. Product design or manufacturing flaws may not be evident initially. The RTCs will perform a series of periodic tests and inspections over the deployment period of nominally three years to identify any failures, concerns, or leading indicators of any reliability or safety problems that may occur in the future. Periodic testing may include: current-voltage curve traces in the field at the string and/or module level; flash testing a subset of modules using a module-scale solar simulator; infrared and electroluminescence imaging; and digital photographs. In addition, all maintenance events (scheduled and unscheduled) will be logged along with any energy lost due to system downtime.